Misen vs OXO
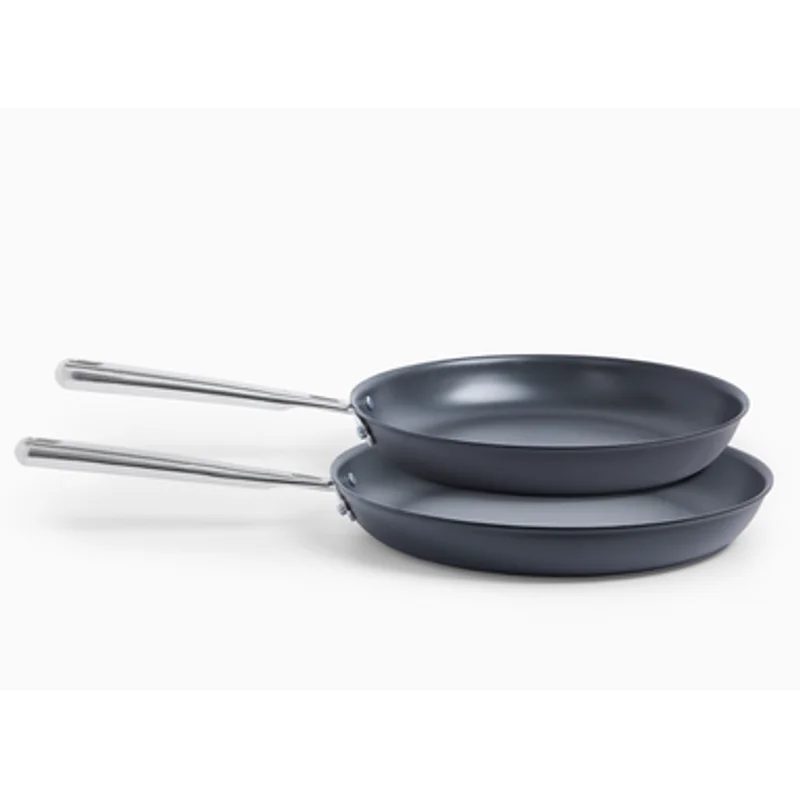
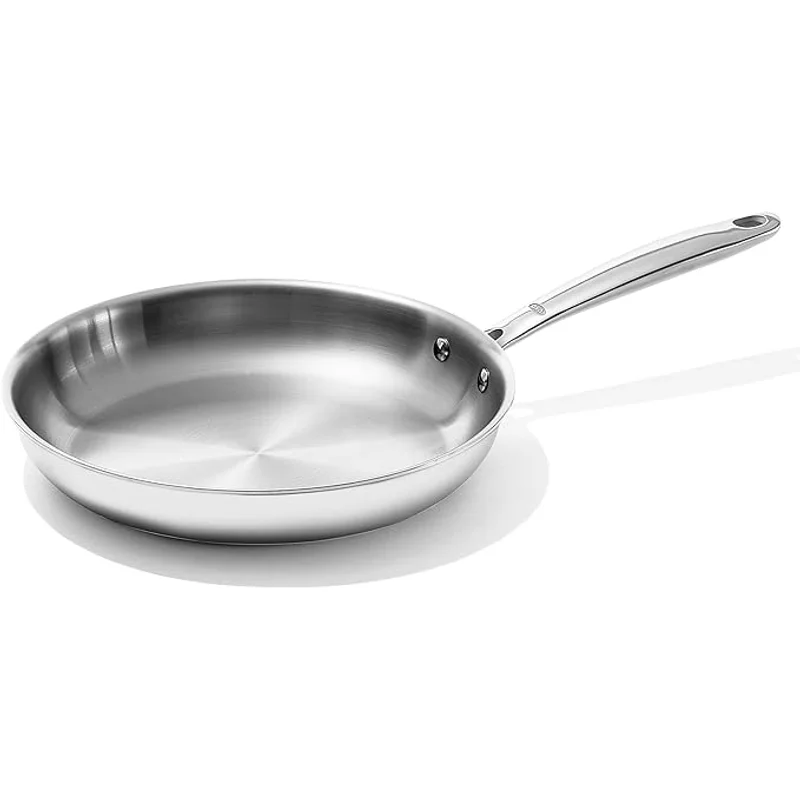
Misen Carbon Steel Fry Pan 10" vs OXO Good Grips Pro Stainless Nonstick Skillet 12 Inch
Get unlimited comparisons with R3 Premium
Full research access
48hr recall alerts
Save 100+ hrs/year
7-day free trial · Cancel anytime
Misen vs OXO
7-day free trial · Cancel anytime
Misen Misen Carbon Steel Fry Pan 10" earns R3's top pick at 7.2/10
After scoring both Frying Pan products across our V4.2 rubric, I'm giving the edge to Misen by 2.3 points. Safety was a key differentiator - Misen scored 8.8/10 vs 1.7/10, and safety carries 50% of our V4.2 rubric weight. At $80 vs $45, the premium is justified by stronger scores across pillars. The OXO scored lower - the right pick depends on your priorities and budget.
Misen wins on:
Misen Carbon Steel Fry Pan 10"
$80
OXO Good Grips Pro Stainless Nonstick Skillet 12 Inch
$45
Feature-by-feature breakdown across 2 products
Misen
Strengths
OXO
Strengths
Weaknesses
Feature Comparison
Misen
8.8
OXO
1.7
Why it matters: Safety carries 50% of the overall score in our V4.2 rubric. We evaluate materials, certifications, and compliance across multiple criteria. Misen scored 8.8/10 vs OXO's 1.7/10.
Misen
Strengths
OXO
Strengths
Feature Comparison
Misen
7.6
OXO
8.9
Why it matters: Our efficacy pillar (20% weight) measures real-world performance - how well the product delivers on its core function. Misen scored 7.6/10 vs OXO's 8.9/10.
Misen
7.2
OXO
4.9
Why it matters: Weighted average of all scoring dimensions.
Misen
Strengths
Weaknesses
OXO
Strengths
Feature Comparison
Misen
3.7
OXO
7.4
Why it matters: Usability (20% weight) covers daily convenience - ease of use, maintenance, and practical considerations. Misen scored 3.7/10 vs OXO's 7.4/10.
Misen
Strengths
Weaknesses
OXO
Strengths
Feature Comparison
Misen
$80
OXO
$45
Why it matters: Lower price is better when quality is comparable.
Misen
1.0
OXO
1.0
Why it matters: Value (10% weight) calculates quality per dollar. Misen: $11/point vs OXO: $9/point. Lower cost-per-point means better value.
OXO has a higher performance rating of 8.9/10.
OXO scores higher on usability with 7.4/10 for cleaning, controls, and daily convenience.
Already have an account? Log in
I'd start with Misen Misen Carbon Steel Fry Pan 10" - it scored 7.2/10 overall in our V4.2 rubric. Safety carries 50% of our scoring weight, followed by performance (20%), usability (20%), and value (10%). Check which pillar matters most to your family and compare those specific scores.
We use our V4.2 deterministic rubric with four weighted pillars: Safety (50%), Efficacy (20%), Usability (20%), and Value (10%). Every score is reproducible - the same product data produces the same score. Each product is evaluated across multiple criteria within each pillar.
Not necessarily. The overall score reflects our weighted rubric, but your priorities may differ. If you care most about safety, compare the safety scores directly. If budget drives your decision, the value scores and prices tell a clearer story. The "right" pick is the one that matches what matters most to your family.


