

Emile Henry vs Staub
Emile Henry
$210AmazonStaub
$299Amazon7-day free trial · Cancel anytime
Two strong Dutch Oven options for different priorities
These products scored within 0.3 points of each other in our V4.2 rubric - essentially a tie. Emile Henry (6.8/10, $210) vs Staub (6.7/10, $299). The best pick depends on which pillar matters most to you: safety (50% weight), performance (20%), usability (20%), or value (10%).
Staub wins on:
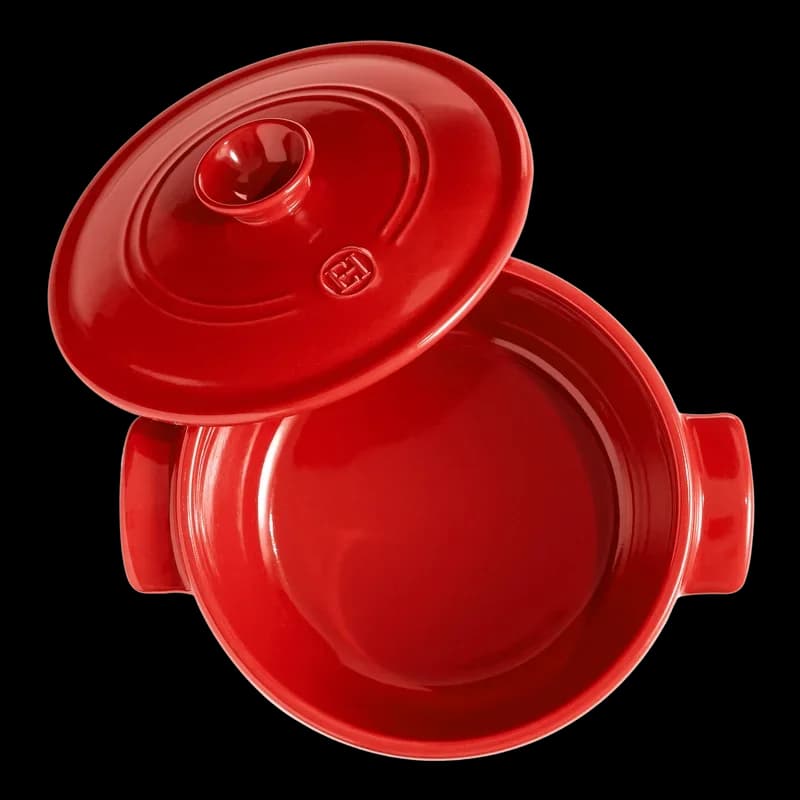
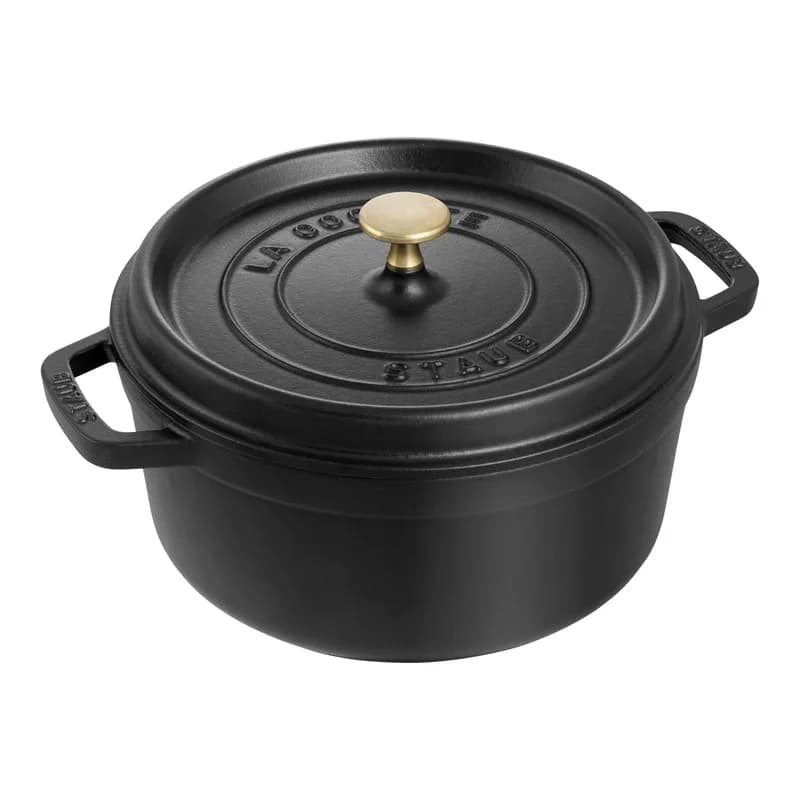
Emile Henry Flame Round Dutch Oven (5.5 qt)
$210
Staub Cast Iron Round Cocotte Dutch Oven (5.5 qt)
$299
Feature-by-feature breakdown across 2 products
Emile Henry
Strengths
Weaknesses
Staub
Strengths
Weaknesses
Feature Comparison
Emile Henry
4.5
Staub
5.9
Why it matters: Safety carries 50% of the overall score in our V4.2 rubric. We evaluate materials, certifications, and compliance across multiple criteria. Emile Henry scored 4.5/10 vs Staub's 5.9/10.
Emile Henry
Strengths
Staub
Strengths
Feature Comparison
Emile Henry
9.4
Staub
10.0
Why it matters: Our efficacy pillar (20% weight) measures real-world performance - how well the product delivers on its core function. Emile Henry scored 9.4/10 vs Staub's 10.0/10.
Emile Henry
6.8
Staub
6.7
Why it matters: Weighted average of all scoring dimensions.
Emile Henry
Strengths
Staub
Strengths
Weaknesses
Feature Comparison
Emile Henry
8.0
Staub
5.1
Why it matters: Usability (20% weight) covers daily convenience - ease of use, maintenance, and practical considerations. Emile Henry scored 8.0/10 vs Staub's 5.1/10.
Emile Henry
Strengths
Staub
Strengths
Weaknesses
Feature Comparison
Emile Henry
$210
Staub
$299
Why it matters: Lower price is better when quality is comparable.
Emile Henry
1.0
Staub
1.0
Why it matters: Value (10% weight) calculates quality per dollar. Emile Henry: $31/point vs Staub: $45/point. Lower cost-per-point means better value.
Emile Henry scores higher on usability with 8.0/10 for cleaning, controls, and daily convenience.
Staub has a higher safety rating of 5.9/10.
Staub has a higher performance rating of 10.0/10.
All products are excellent choices. Consider which specific features matter most to your family.
Already have an account? Log in
Both scored close to 6.8/10, so the better choice depends on your priorities. Safety carries 50% of our scoring weight, followed by performance (20%), usability (20%), and value (10%). Check which pillar matters most to your family and compare those specific scores.
We use our V4.2 deterministic rubric with four weighted pillars: Safety (50%), Efficacy (20%), Usability (20%), and Value (10%). Every score is reproducible - the same product data produces the same score. Each product is evaluated across multiple criteria within each pillar.
Not necessarily. The overall score reflects our weighted rubric, but your priorities may differ. If you care most about safety, compare the safety scores directly. If budget drives your decision, the value scores and prices tell a clearer story. The "right" pick is the one that matches what matters most to your family.